




- orshu
- •
- 7 Min Read
- •
- 3 hours ago


Key Points
- The Hang Seng Index (^HSI) rose 1.46%, gaining 335.77 points to close at 23,294.42 on October 30, 2026, while recording a 0.87% advance over five trading days.
- The benchmark traded between 22,947.96 and 23,400.02 during the session, finishing above its previous close of 22,958.70.
- The index remained near the lower end of its 52-week range of 22,518.00–28,056.10, with the sustainability of further gains dependent on Chinese economic conditions, corporate earnings, and global monetary policy.
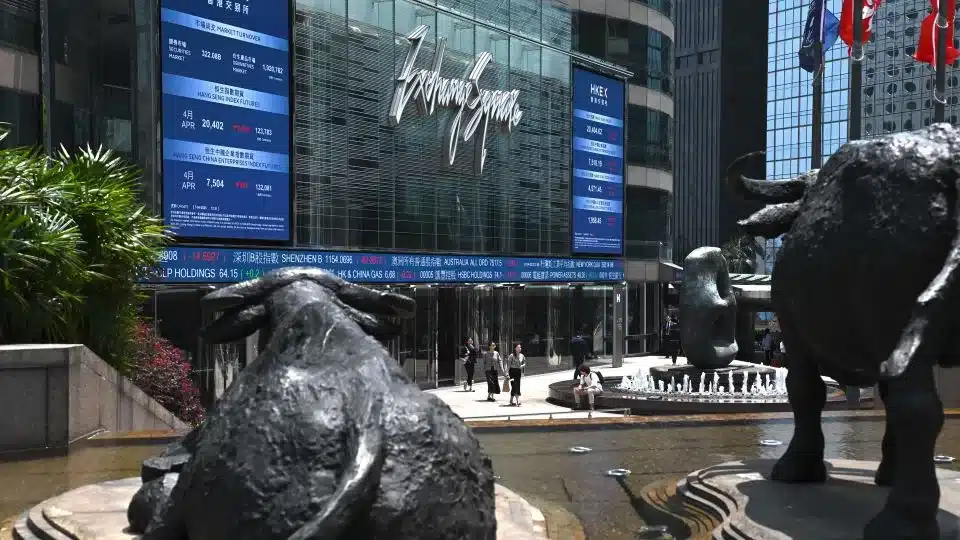
The Hang Seng Index (^HSI) ended the October 30 session higher, rising 1.46%, or 335.77 points, to close at 23,294.42. The advance brought its five-day performance to a gain of 0.87%, reflecting a positive finish to the week for Hong Kong equities. Investors continued to assess the outlook for China’s economy, policy support from Beijing, corporate earnings, and international interest rate developments. For global investors, including Israeli institutional asset managers with exposure to Asian equities, the index remains an important gauge of sentiment toward Hong Kong-listed companies and the broader Chinese corporate sector.
Daily Performance and the Broader Trading Range
The benchmark opened at 23,011.29 and traded between an intraday low of 22,947.96 and a high of 23,400.02 before closing at 23,294.42. The final level represented an increase of 335.77 points from the previous close of 22,958.70.
Despite the daily recovery and positive weekly performance, the index remained closer to the lower end of its 52-week range of 22,518.00 to 28,056.10. This positioning indicates that the latest advance has not yet reversed the broader distance from the index’s annual high. The reported index-level trading volume was unavailable, although the supplied data listed a three-month average daily volume of 2,733,104,761. That figure should be interpreted cautiously because index-level volume conventions may differ from those used for individual securities or exchange-traded products.
Technology, Financials, and Chinese Corporate Earnings
The Hang Seng Index’s performance is influenced by major technology companies, financial institutions, consumer businesses, energy producers, and electric vehicle manufacturers. Developments affecting these sectors can shape the benchmark’s direction, particularly when changes in earnings expectations or valuations influence large constituents.
Investors are monitoring the ability of Chinese technology companies to translate artificial intelligence investment into sustainable revenue and profits, alongside consumer demand and the financial health of businesses exposed to China’s property market. The durability of corporate earnings and the effectiveness of policy measures intended to support economic activity will remain important considerations in assessing whether the latest gains can extend beyond a short-term rebound.
Monetary Policy, Currency Dynamics, and Market Risks
Hong Kong’s monetary conditions remain closely linked to those of the United States through the Linked Exchange Rate System. Consequently, Federal Reserve policy expectations and movements in U.S. interest rates can influence local liquidity conditions and investor appetite for Hong Kong equities. Developments in People’s Bank of China liquidity operations and broader mainland economic policy also remain relevant to the outlook.
For Israeli investors, currency movements and international portfolio allocation add further considerations when assessing returns from Hong Kong-listed assets. Changes in the shekel against major currencies, global risk sentiment, and cross-border capital flows can affect portfolio performance beyond the index’s reported local-currency movement.
Outlook: The Hang Seng Index’s 1.46% daily gain and 0.87% weekly advance provide a positive near-term signal, but the broader outlook remains dependent on evidence of improving corporate profitability and sustained economic support from Beijing. A continued recovery would require stronger earnings expectations, stable global financial conditions, and improving investor confidence. Conversely, weaker Chinese demand, renewed property-sector concerns, shifts in U.S. monetary policy, or reduced risk appetite could limit further progress. Investors will therefore continue to monitor economic data, corporate results, policy announcements, and movements in the index relative to its annual trading range.
Comparison, examination, and analysis between investment houses
Leave your details, and an expert from our team will get back to you as soon as possible
* This article, in whole or in part, does not contain any promise of investment returns, nor does it constitute professional advice to make investments in any particular field.
To read more about the full disclaimer, click here
- Lior mor
- •
- 8 Min Read
- •
- ago 46 minutes
SKN | Japanese Yen Index Edges Up 0.06% to 63.46, Despite a 0.48% Weekly Decline
The Japanese Yen Currency Index (^XDN) finished the October 30 trading session marginally higher, gaining 0.06%, or 0.04 points,
- ago 46 minutes
- •
- 8 Min Read

The Japanese Yen Currency Index (^XDN) finished the October 30 trading session marginally higher, gaining 0.06%, or 0.04 points,

- Arik Arkadi Sluzki
- •
- 7 Min Read
- •
- ago 1 hour
SKN | Australian Dollar Index Slips 0.03% to 70.30, Extending Weekly Decline to 0.08%
The Australian Dollar Currency Index (^XDA) finished the October 30 trading session slightly lower, declining 0.03%, equivalent to 0.02
- ago 1 hour
- •
- 7 Min Read

The Australian Dollar Currency Index (^XDA) finished the October 30 trading session slightly lower, declining 0.03%, equivalent to 0.02

- sagi habasov
- •
- 7 Min Read
- •
- ago 2 hours
SKN | SSE Composite Index Falls 1.44% to 3,599.02, Extending Weekly Losses to 2.48%
The SSE Composite Index (000001.SS) ended the October 30 trading session under pressure, falling 1.44%, or 52.42 points, to
- ago 2 hours
- •
- 7 Min Read
The SSE Composite Index (000001.SS) ended the October 30 trading session under pressure, falling 1.44%, or 52.42 points, to
- sagi habasov
- •
- 8 Min Read
- •
- ago 10 hours
SKN | Elon Musk’s Colossus 2 Expansion Targets 1.2 Million Nvidia Blackwell GPUs for AI Infrastructure
Elon Musk has outlined a significant expansion of xAI’s Colossus 2 supercomputer infrastructure in Memphis, Tennessee, with a target
- ago 10 hours
- •
- 8 Min Read

Elon Musk has outlined a significant expansion of xAI’s Colossus 2 supercomputer infrastructure in Memphis, Tennessee, with a target