




- Lior mor
- •
- 6 Min Read
- •
- 15 seconds ago


Key Points
- Cboe Volatility Index (VIX) ended Friday at 14.87, down 0.80 points, or 5.11%, in the final session.
- The VIX gained just 0.41% over the five-day period, indicating that overall volatility remained relatively contained despite a sharp midweek increase.
- The weekly range highlights a temporary volatility spike above 16, followed by a decline toward 15, leaving interest rates, equities, geopolitics and currency risk important for the near-term outlook.
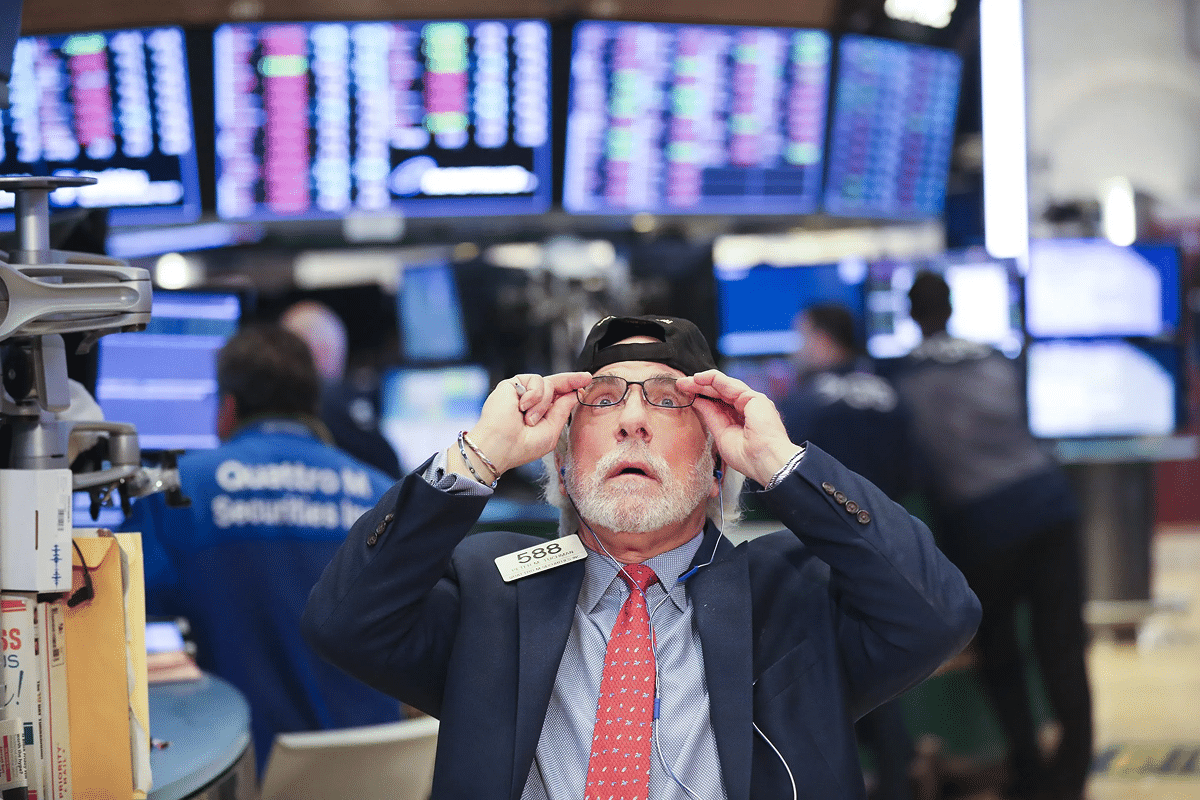
The Cboe Volatility Index (VIX) finished Friday at 14.87, falling 5.11% during the session while recording a marginal 0.41% increase over the five-day period shown in the attached data. The movement suggests that while U.S. equity markets experienced periods of sharper price swings during the week, investors’ broader demand for equity-market protection remained relatively restrained.
Midweek Volatility Spike Fades
The five-day chart shows a notable change in volatility conditions during the week. The VIX initially moved lower, reaching levels around 14.2 before reversing sharply on September 23 and September 24. During that period, the index climbed above 16.00, briefly approaching the upper end of the displayed range near 16.5.
The increase was subsequently reversed. By September 25, the VIX had gradually declined, eventually returning below 15.00. Friday’s session ranged between 14.68 and 15.94, before the index closed at 14.87. The pattern indicates that the week’s volatility episode was significant but relatively short-lived rather than developing into a sustained increase in market stress.
VIX Remains Well Below Its 52-Week High
The current level also needs to be viewed against the index’s broader historical range. The attached data shows a 52-week range of 13.38 to 35.30, placing Friday’s close much closer to the lower end than the upper end of that range. This suggests that, based solely on the VIX level, markets were not pricing an environment comparable with periods of severe equity-market disruption.
For Israeli investors with exposure to U.S. equities through pension funds, ETFs and global portfolios, the VIX remains an important complementary indicator. A relatively low VIX can coincide with strong risk appetite, but it does not eliminate portfolio sensitivity to USD/ILS movements, global bond yields and geopolitical developments.
What Could Change the Volatility Outlook?
The near-term outlook for volatility will depend on whether the recent decline in the VIX is sustained. A continued period of stable equity trading could keep the index near current levels, while renewed pressure on technology valuations, higher Treasury yields, unexpected inflation data or shifts in Federal Reserve expectations could produce another volatility increase.
Geopolitical risk and fiscal uncertainty also remain potential catalysts. A sudden escalation in geopolitical tensions, changes in energy prices or renewed currency-market volatility could affect global risk appetite even if U.S. economic fundamentals remain relatively resilient.
The outlook therefore remains one of contained but reversible volatility. Friday’s decline to 14.87 indicates that the midweek spike had largely faded by the end of the period, but the move above 16 during the week demonstrates that risk pricing can change quickly. Investors and asset allocators will be watching whether the VIX remains anchored near the lower end of its annual range or begins establishing a sustained higher trading range as markets digest incoming macroeconomic, monetary-policy and geopolitical developments.
Comparison, examination, and analysis between investment houses
Leave your details, and an expert from our team will get back to you as soon as possible
* This article, in whole or in part, does not contain any promise of investment returns, nor does it constitute professional advice to make investments in any particular field.
To read more about the full disclaimer, click here
- Arik Arkadi Sluzki
- •
- 7 Min Read
- •
- ago 11 minutes
SKN | US Dollar Index (DX-Y.NYB) Edges Up 0.06% Daily to 101.04: Is the Greenback Establishing Support Near 101 Following a 0.60% 5-Day Expansion?
The US Dollar Index (DX-Y.NYB) demonstrated steady structural strength across recent trading sessions, advancing 0.06% (0.06 points) in its
- ago 11 minutes
- •
- 7 Min Read

The US Dollar Index (DX-Y.NYB) demonstrated steady structural strength across recent trading sessions, advancing 0.06% (0.06 points) in its

- sagi habasov
- •
- 7 Min Read
- •
- ago 33 minutes
SKN | Russell 2000 Index (^RUT) Edges Up 0.07% Daily to 2,837.55: Are U.S. Small-Caps Finding a Base Below 2,850 Following a 0.80% 5-Day Contraction?
The Russell 2000 Index (^RUT) demonstrated localized holding pattern behavior across recent U.S. trading sessions, edging up 0.07% (1.98
- ago 33 minutes
- •
- 7 Min Read
The Russell 2000 Index (^RUT) demonstrated localized holding pattern behavior across recent U.S. trading sessions, edging up 0.07% (1.98

- orshu
- •
- 6 Min Read
- •
- ago 51 minutes
SKN | Nasdaq Composite Gains 2.06% as Technology Stocks Recover From Midweek Volatility
The Nasdaq Composite ended the week at 27,068.72, gaining 129.34 points, or 0.48%, in Friday's session and advancing 2.06%
- ago 51 minutes
- •
- 6 Min Read

The Nasdaq Composite ended the week at 27,068.72, gaining 129.34 points, or 0.48%, in Friday's session and advancing 2.06%

- Ronny Mor
- •
- 6 Min Read
- •
- ago 1 hour
SKN | S&P 500 Gains 1.21% for the Week as September Volatility Tests Market Resilience
The S&P 500 finished the week ending Friday, September 25, at 7,743.41, up 39.28 points, or 0.51%, in the
- ago 1 hour
- •
- 6 Min Read

The S&P 500 finished the week ending Friday, September 25, at 7,743.41, up 39.28 points, or 0.51%, in the
