





- Ronny Mor
- •
- 6 Min Read
- •
- 28 seconds ago


Key Points
- The TA-SME60 index rose 0.68% on Friday to 1,218.87, recovering modestly after a week of substantial selling pressure.
- The index fell 5.98% over the week, extending its declines to 8.65% over one month and 12.30% over three months.
- The outlook depends on whether Friday’s rebound develops into sustained stabilization, with interest rates, domestic economic conditions, currency volatility and geopolitical risks remaining important factors.
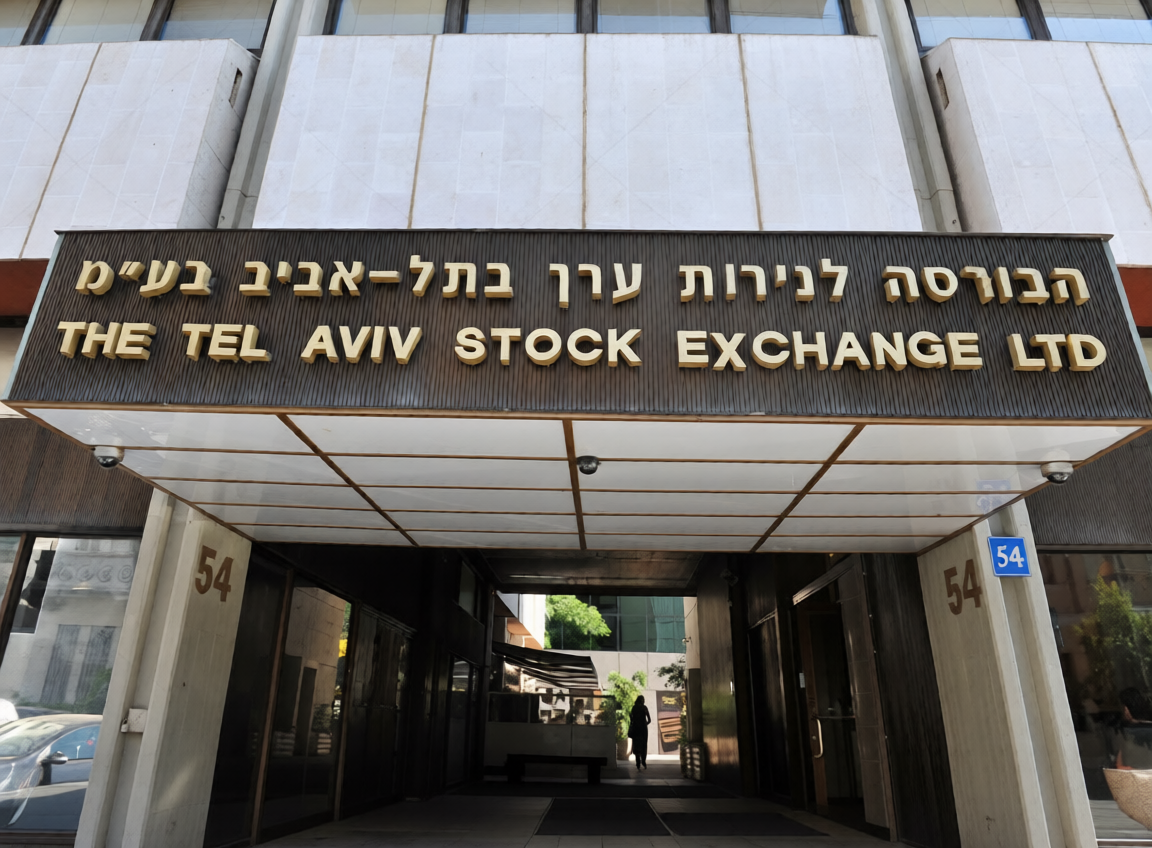
The Tel Aviv Stock Exchange’s TA-SME60 index ended Friday, October 9, at 1,218.87, gaining 8.28 points, or 0.68%, in a session that offered limited relief following a difficult week for Israeli small-cap equities. Despite the late-week recovery, the index’s 5.98% weekly decline highlights continuing pressure on smaller listed companies, whose valuations can be particularly sensitive to financing costs, liquidity conditions and changes in investor risk appetite.
A Friday Rebound Does Little to Reverse the Weekly Loss
The index closed above its previous close of 1,210.59, while Friday’s trading range extended from 1,210.53 to 1,227.28. The recovery suggests that some buyers returned after the recent weakness, but a single positive session is not sufficient to establish a durable change in market direction. The index remained well below its levels earlier in the week, reflecting the scale of the preceding decline.
Trading volume reached approximately 6.67 million shares, compared with a three-month average of about 5.18 million. The higher-than-average activity indicates that the session attracted meaningful participation, although the available figures do not establish whether the volume reflected institutional accumulation, short-term positioning or other trading flows.
Medium-Term Performance Signals Broader Weakness
The weekly decline forms part of a more persistent correction. The TA-SME60 was down 8.65% over one month and 12.30% over three months, while its six-month performance showed a 14.55% loss. These figures point to sustained weakness rather than an isolated period of volatility. Over the one-year period, the index was marginally lower, by approximately 0.23%, despite remaining substantially above its level five years earlier, with a reported five-year gain of 50.13%.
The index’s 52-week range of 1,176.46 to 1,576.29 provides additional perspective. At 1,218.87, it was trading relatively close to the lower end of that range. This may leave room for recovery if sentiment improves, but it also underscores the risk that renewed selling could test recent lows. Past performance does not establish where the market will find support.
Israeli Small Caps Face a Complex Macro Backdrop
Smaller companies can be especially exposed to tighter credit conditions, weaker domestic demand and uncertainty about future earnings. Unlike larger companies with diversified international revenue streams, some small-cap businesses have less flexibility to absorb higher borrowing costs or unexpected operating expenses. For investors in Israel, these concerns also interact with geopolitical uncertainty, shekel volatility and changes in the global cost of capital.
International interest-rate expectations and global equity sentiment may influence foreign participation in Israeli assets, while domestic economic growth and corporate earnings will remain important determinants of local valuations. A reduction in perceived risk could support a recovery, but renewed geopolitical tensions, disappointing earnings or persistent financing pressures could prolong the correction.
Looking ahead, the key question is whether the TA-SME60 can maintain its rebound and establish a more stable trading range. Investors will be watching subsequent sessions for follow-through, changes in trading activity and signs that selling pressure is easing. Until the index demonstrates sustained improvement, Friday’s advance is best viewed as a tentative recovery rather than confirmation that the broader downtrend has ended.
Comparison, examination, and analysis between investment houses
Leave your details, and an expert from our team will get back to you as soon as possible
* This article, in whole or in part, does not contain any promise of investment returns, nor does it constitute professional advice to make investments in any particular field.
To read more about the full disclaimer, click here
- omer bar
- •
- 6 Min Read
- •
- ago 52 minutes
SKN | Japanese Yen Currency Index (^XDN) Softens 0.28% Daily to 63.17 as 0.28% Weekly Pullback Holds Above 60.98 Support
The Japanese Yen Currency Index (^XDN) finished the trading session on October 9, 2026, lower, dropping 0.28% (0.18 points)
- ago 52 minutes
- •
- 6 Min Read

The Japanese Yen Currency Index (^XDN) finished the trading session on October 9, 2026, lower, dropping 0.28% (0.18 points)

- Lior mor
- •
- 7 Min Read
- •
- ago 2 hours
SKN | KOSPI Composite Index (^KS11) Softens 2.62% Daily to 6,625.93 as 4.95% Weekly Pullback Holds Above 3,522 Support
The KOSPI Composite Index (^KS11) finished the trading session on October 8, 2026, lower, dropping 2.62% (177.97 points) to
- ago 2 hours
- •
- 7 Min Read

The KOSPI Composite Index (^KS11) finished the trading session on October 8, 2026, lower, dropping 2.62% (177.97 points) to

- Arik Arkadi Sluzki
- •
- 7 Min Read
- •
- ago 2 hours
SKN | Nikkei 225 (^N225) Softens 0.02% Daily to 69,030.92 as 1.31% Weekly Pullback Holds Above 46,544 Support
The Nikkei 225 Index (^N225) finished the trading session on October 9, 2026, virtually flat, edging lower by 0.02%
- ago 2 hours
- •
- 7 Min Read

The Nikkei 225 Index (^N225) finished the trading session on October 9, 2026, virtually flat, edging lower by 0.02%
- omer bar
- •
- 6 Min Read
- •
- ago 10 hours
SKN | Telecom Stocks Slide as SpaceX Spectrum Deal Raises New Competitive Threat
U.S. and European telecommunications stocks came under pressure on Friday after SpaceX’s acquisition of low-band spectrum intensified concerns that
- ago 10 hours
- •
- 6 Min Read

U.S. and European telecommunications stocks came under pressure on Friday after SpaceX’s acquisition of low-band spectrum intensified concerns that

