





- Lior mor
- •
- 6 Min Read
- •
- 52 seconds ago


Key Points
- The Euronext 100 Index closed at 1,859.81, gaining 0.53% on the latest session while remaining down approximately 0.78% over the five-day period.
- The index experienced a notable midweek decline, briefly approaching the 1,830 level before recovering toward the end of the week.
- The near-term outlook will depend on whether the index can sustain its recovery, with interest rates, corporate earnings, economic growth and currency movements remaining important factors for European investors.
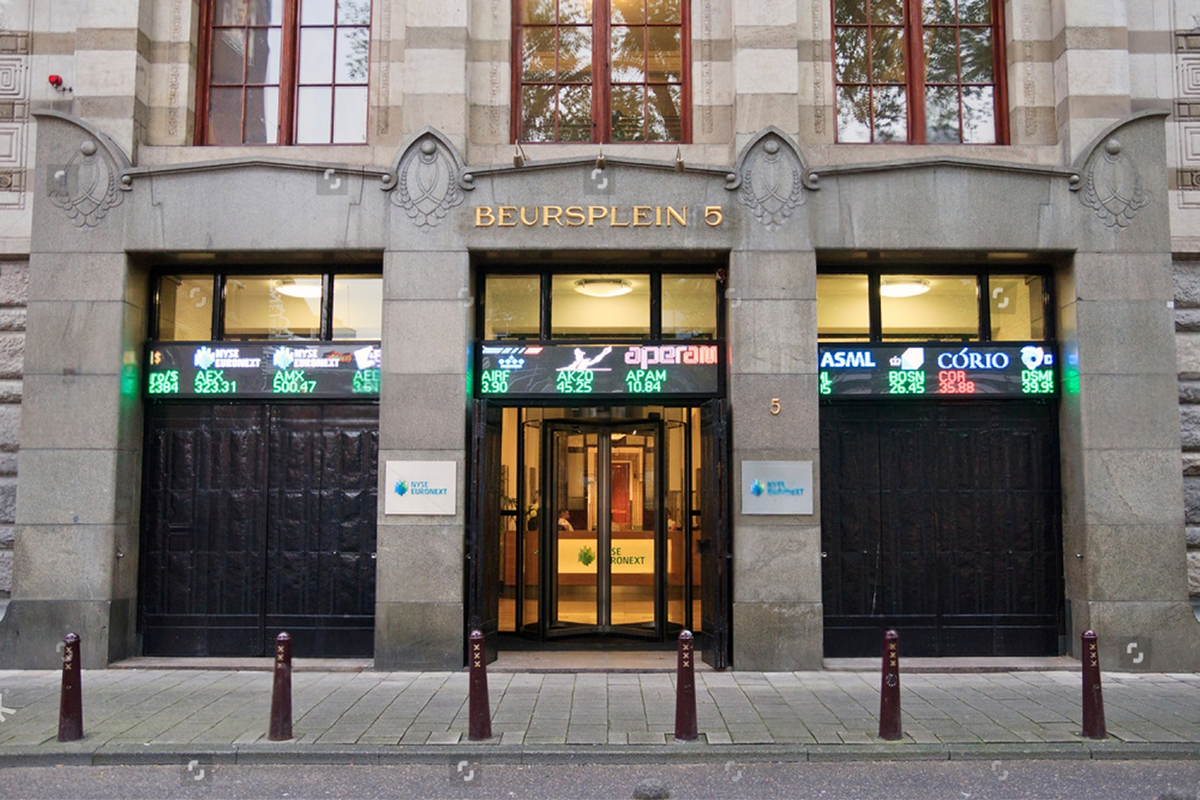
The Euronext 100 Index (^N100) ended the latest session at 1,859.81, advancing 9.82 points, or 0.53%, according to the supplied market data. Despite Friday’s positive performance, the five-day chart indicates a weekly decline of approximately 0.78%, highlighting the difference between a short-term rebound and a broader recovery in European equities.
Midweek Selling Weighs on the Weekly Performance
The index began the displayed period near the upper end of its trading range, around 1,890, before weakening as the week progressed. Selling pressure became particularly visible on October 7 and October 8, when the index moved below 1,870 and briefly approached the 1,830 area. This decline suggests that investors faced difficulty sustaining the market’s earlier levels, although the chart alone does not establish the specific catalysts behind the move.
The subsequent recovery brought the index back toward 1,860, but the rebound did not fully reverse the preceding losses. This distinction matters for investors assessing European market momentum: a positive daily return can indicate improving sentiment without confirming that the broader downward movement has ended.
Trading Range Highlights the Market’s Fragile Recovery
The supplied figures show a previous close of 1,849.99 and an opening level of 1,849.06. The displayed daily range extended from 1,849.06 to 1,866.59, while the 52-week range stood at 1,643.41–1,984.60. The latest close therefore remains below the annual high, but comfortably above the reported 52-week low.
The five-day chart also shows the index recovering from its midweek trough, with prices stabilizing around the 1,850–1,860 area toward the end of the period. Whether this zone develops into a base for further gains remains uncertain. The supplied volume reading is zero, while average volume is reported at approximately 336.3 million; the zero reading should not be interpreted as an absence of trading, because the screenshot may reflect a delayed or unavailable volume field.
European Equities Outlook: What Investors Should Monitor
For global investors, the Euronext 100 provides exposure to major companies listed across European markets. Its next direction will depend partly on broader economic conditions, earnings expectations and the path of European interest rates. Changes in borrowing costs can influence equity valuations, while weaker demand or disappointing corporate guidance could limit the durability of any rebound.
For Israeli investors, European equities also introduce currency risk, particularly when euro-denominated returns are translated into shekels. Exchange-rate movements can either strengthen or erode portfolio performance independently of changes in the underlying index.
Looking ahead, the key question is whether the Euronext 100 can hold above the 1,850 area and build on its latest advance. A sustained move higher could indicate improving momentum, whereas renewed selling and a break toward the midweek lows would suggest that pressure remains unresolved. Until the index establishes a clearer direction, the latest rebound should be viewed as an encouraging but inconclusive signal.
Comparison, examination, and analysis between investment houses
Leave your details, and an expert from our team will get back to you as soon as possible
* This article, in whole or in part, does not contain any promise of investment returns, nor does it constitute professional advice to make investments in any particular field.
To read more about the full disclaimer, click here
- sagi habasov
- •
- 7 Min Read
- •
- ago 16 minutes
SKN | CAC 40 (^FCHI) Advances 0.95% Daily to 7,803.33 as 1.19% Weekly Pullback Holds Above 7,505 Support
The CAC 40 Index (^FCHI) finished the trading session higher, advancing 0.95% (73.64 points) to settle near 7,803.33 Euros.
- ago 16 minutes
- •
- 7 Min Read

The CAC 40 Index (^FCHI) finished the trading session higher, advancing 0.95% (73.64 points) to settle near 7,803.33 Euros.

- orshu
- •
- 7 Min Read
- •
- ago 33 minutes
SKN | MSCI Europe (^125904-USD-STRD) Advances 0.84% Daily to 2,694.60 as 0.38% Weekly Pullback Holds Above 2,442 Support
The MSCI Europe Index (^125904-USD-STRD) finished the trading session higher, advancing 0.84% (22.37 points) to settle near 2,694.60 USD. The
- ago 33 minutes
- •
- 7 Min Read

The MSCI Europe Index (^125904-USD-STRD) finished the trading session higher, advancing 0.84% (22.37 points) to settle near 2,694.60 USD. The

- Ronny Mor
- •
- 6 Min Read
- •
- ago 1 hour
SKN | FTSE 100 (^FTSE) Advances 1.06% Daily to 10,552.05 as 0.86% Weekly Gain Holds Above 9,276 Support
The FTSE 100 Index (^FTSE) finished the trading session on October 9, 2026, higher, advancing 1.06% (110.45 points) to
- ago 1 hour
- •
- 6 Min Read

The FTSE 100 Index (^FTSE) finished the trading session on October 9, 2026, higher, advancing 1.06% (110.45 points) to

- omer bar
- •
- 7 Min Read
- •
- ago 1 hour
SKN | DAX P (^GDAXI) Advances 1.13% Daily to 25,087.27 as 0.57% Weekly Pullback Holds Above 21,863 Support
The DAX P Index (^GDAXI) finished the trading session higher, advancing 1.13% (280.30 points) to settle near 25,087.27 Euros.
- ago 1 hour
- •
- 7 Min Read

The DAX P Index (^GDAXI) finished the trading session higher, advancing 1.13% (280.30 points) to settle near 25,087.27 Euros.

