




- sagi habasov
- •
- 8 Min Read
- •
- 16 seconds ago


Key Points
- 85% of S&P 500 constituents are reportedly at least 10% below their all-time highs, while 59% have fallen at least 20%.
- Approximately 41% of stocks are down at least 30% from their peaks, and 17% have declined at least 50%, according to the attached market data.
- The Magnificent Seven reportedly gained 7.7% since August 3, while the S&P 500 rose 2.6% and the equal-weighted S&P 500 fell 3.0%, highlighting the divergence between index performance and the broader market.
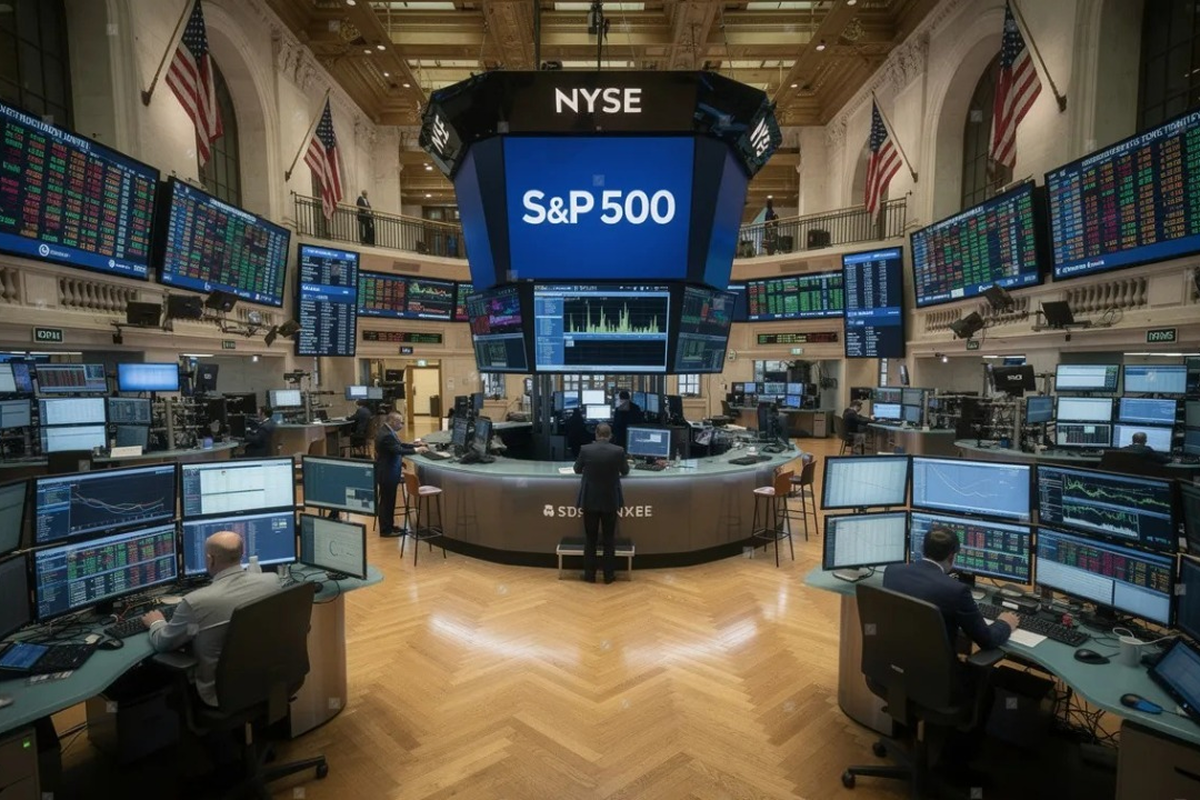
The U.S. stock market is showing a sharp divergence between the performance of its headline indexes and the experience of individual companies. According to the figures shared by Global Markets Investor and attributed to Bloomberg, most S&P 500 constituents are trading well below their historical peaks even as a small group of mega-cap stocks has helped support the benchmark.
Market Breadth Signals Widespread Weakness Beneath the Index
The attached data indicate that 85% of S&P 500 stocks are at least 10% below their all-time highs. The weakness becomes more pronounced at larger drawdown thresholds: 59% are down at least 20%, 41% have declined at least 30%, 26% are down at least 40%, and 17% have fallen at least 50% from their respective peaks.
These figures highlight the importance of distinguishing between an index’s performance and the performance of its constituents. The S&P 500 is market-capitalization weighted, meaning its largest companies exert a greater influence on its overall return. Consequently, strong gains among a handful of dominant stocks can offset weakness across a much larger number of smaller constituents.
A decline from an all-time high is also different from a conventional bear-market measure. The figures describe how far stocks have fallen from their individual peaks, not necessarily how much they have declined over a specific period. A company can remain substantially below its record high while recovering from a recent low, so the data should be interpreted as a measure of drawdown rather than a direct forecast of future returns.
Mega-Cap Leaders Mask the Broader Market’s Performance
The accompanying report highlights the concentration of recent gains. Since August 3, the Magnificent Seven reportedly advanced 7.7%, while the S&P 500 gained 2.6%. In contrast, the equal-weighted S&P 500 declined 3.0% over the same period, according to the source post.
The difference between the capitalization-weighted and equal-weighted indexes is particularly relevant. In the capitalization-weighted benchmark, companies with larger market values have more influence over returns. The equal-weighted version gives each constituent a more comparable starting weight, providing a different perspective on participation across the market. When the two measures diverge, it can indicate that index gains are concentrated among the largest companies rather than being shared broadly.
Large technology and AI-related companies have been important contributors to U.S. equity-market performance. Their earnings growth, capital spending and position in the digital economy can support valuations, but their size also means that changes in their share prices can significantly influence the headline index. Narrow leadership does not automatically mean a market correction is imminent, but it can leave benchmark performance more sensitive to disappointing results from a small group of influential companies.
Why the Divergence Matters for Global Investors
Weak market breadth can reflect several conditions, including rising financing costs, uneven earnings growth, sector-specific pressure and investors concentrating their exposure in companies perceived to have stronger growth prospects. However, the attached figures alone do not establish which factors account for the declines across individual stocks, nor do they demonstrate that all companies trading below their peaks face deteriorating fundamentals.
For global investors, including those in Israel, the distinction matters because exposure to a major U.S. index can still be heavily influenced by its largest constituents. A positive benchmark return may not reflect the experience of portfolios with different sector weights or greater exposure to smaller companies. The divergence also reinforces the value of examining earnings revisions, valuation levels and sector participation alongside headline index movements.
Going forward, investors will be watching whether market participation broadens, whether the equal-weighted S&P 500 begins to recover relative to its capitalization-weighted counterpart, and whether earnings growth extends beyond the largest technology companies. A wider recovery could make index gains less dependent on a small group of leaders. If weakness persists across the broader constituent base while mega-cap performance deteriorates, however, the S&P 500 could become more vulnerable to a sustained decline. The central question is whether the current divergence represents a temporary rotation in leadership or a more persistent challenge for the breadth of the U.S. equity market.
Comparison, examination, and analysis between investment houses
Leave your details, and an expert from our team will get back to you as soon as possible
* This article, in whole or in part, does not contain any promise of investment returns, nor does it constitute professional advice to make investments in any particular field.
To read more about the full disclaimer, click here
- Ronny Mor
- •
- 8 Min Read
- •
- ago 14 hours
SKN | World’s 10 Largest Companies Reach $31.21 Trillion in Combined Market Value as Big Tech Dominates Global Markets
The combined market value of the world's 10 largest companies increased to approximately $31.21 trillion, according to the attached
- ago 14 hours
- •
- 8 Min Read

The combined market value of the world's 10 largest companies increased to approximately $31.21 trillion, according to the attached

- sagi habasov
- •
- 7 Min Read
- •
- ago 14 hours
SKN | S&P 500 Weekly Review: Constellation Energy Soars as AI Power Demand Reshapes Market Leadership
U.S. equities finished the week ended October 9, 2026, higher, but individual stock performance remained uneven across the S&P
- ago 14 hours
- •
- 7 Min Read

U.S. equities finished the week ended October 9, 2026, higher, but individual stock performance remained uneven across the S&P

- Lior mor
- •
- 6 Min Read
- •
- ago 15 hours
SKN | Global Stocks Advance as Earnings Approach Despite High Treasury Yields and Oil Prices
Global stocks moved higher on Friday as investors balanced improving equity sentiment against still-elevated government bond yields and oil
- ago 15 hours
- •
- 6 Min Read

Global stocks moved higher on Friday as investors balanced improving equity sentiment against still-elevated government bond yields and oil
- Lior mor
- •
- 6 Min Read
- •
- ago 2 days
SKN | Wall Street Ends Week Higher as Earnings and Inflation Data Take Center Stage
Wall Street closed higher on Friday as investors shifted their attention toward the next stage of the market calendar,
- ago 2 days
- •
- 6 Min Read

Wall Street closed higher on Friday as investors shifted their attention toward the next stage of the market calendar,
