




- Ronny Mor
- •
- 6 Min Read
- •
- 15 seconds ago


Key Points
- The SSE Composite Index (000001.SS) concluded the trading week at 3,930.12, recording a 5-day net contraction of 0.56% as early intraday gains faded into Friday's close.
- A Friday session dip shaved 11.97 points (0.30%), pulling the index down from an opening price of 3,955.55 to settle near 3,930.12 within a daily trading range of 3,915.22 to 3,980.20 on volume of 2.19 billion shares.
- For global and Israeli asset allocators, this mainland consolidation underscores the necessity of managing Asian equity exposure, balancing Beijing stimulus expectations against persistent shekel volatility and foreign exchange risk parameters.
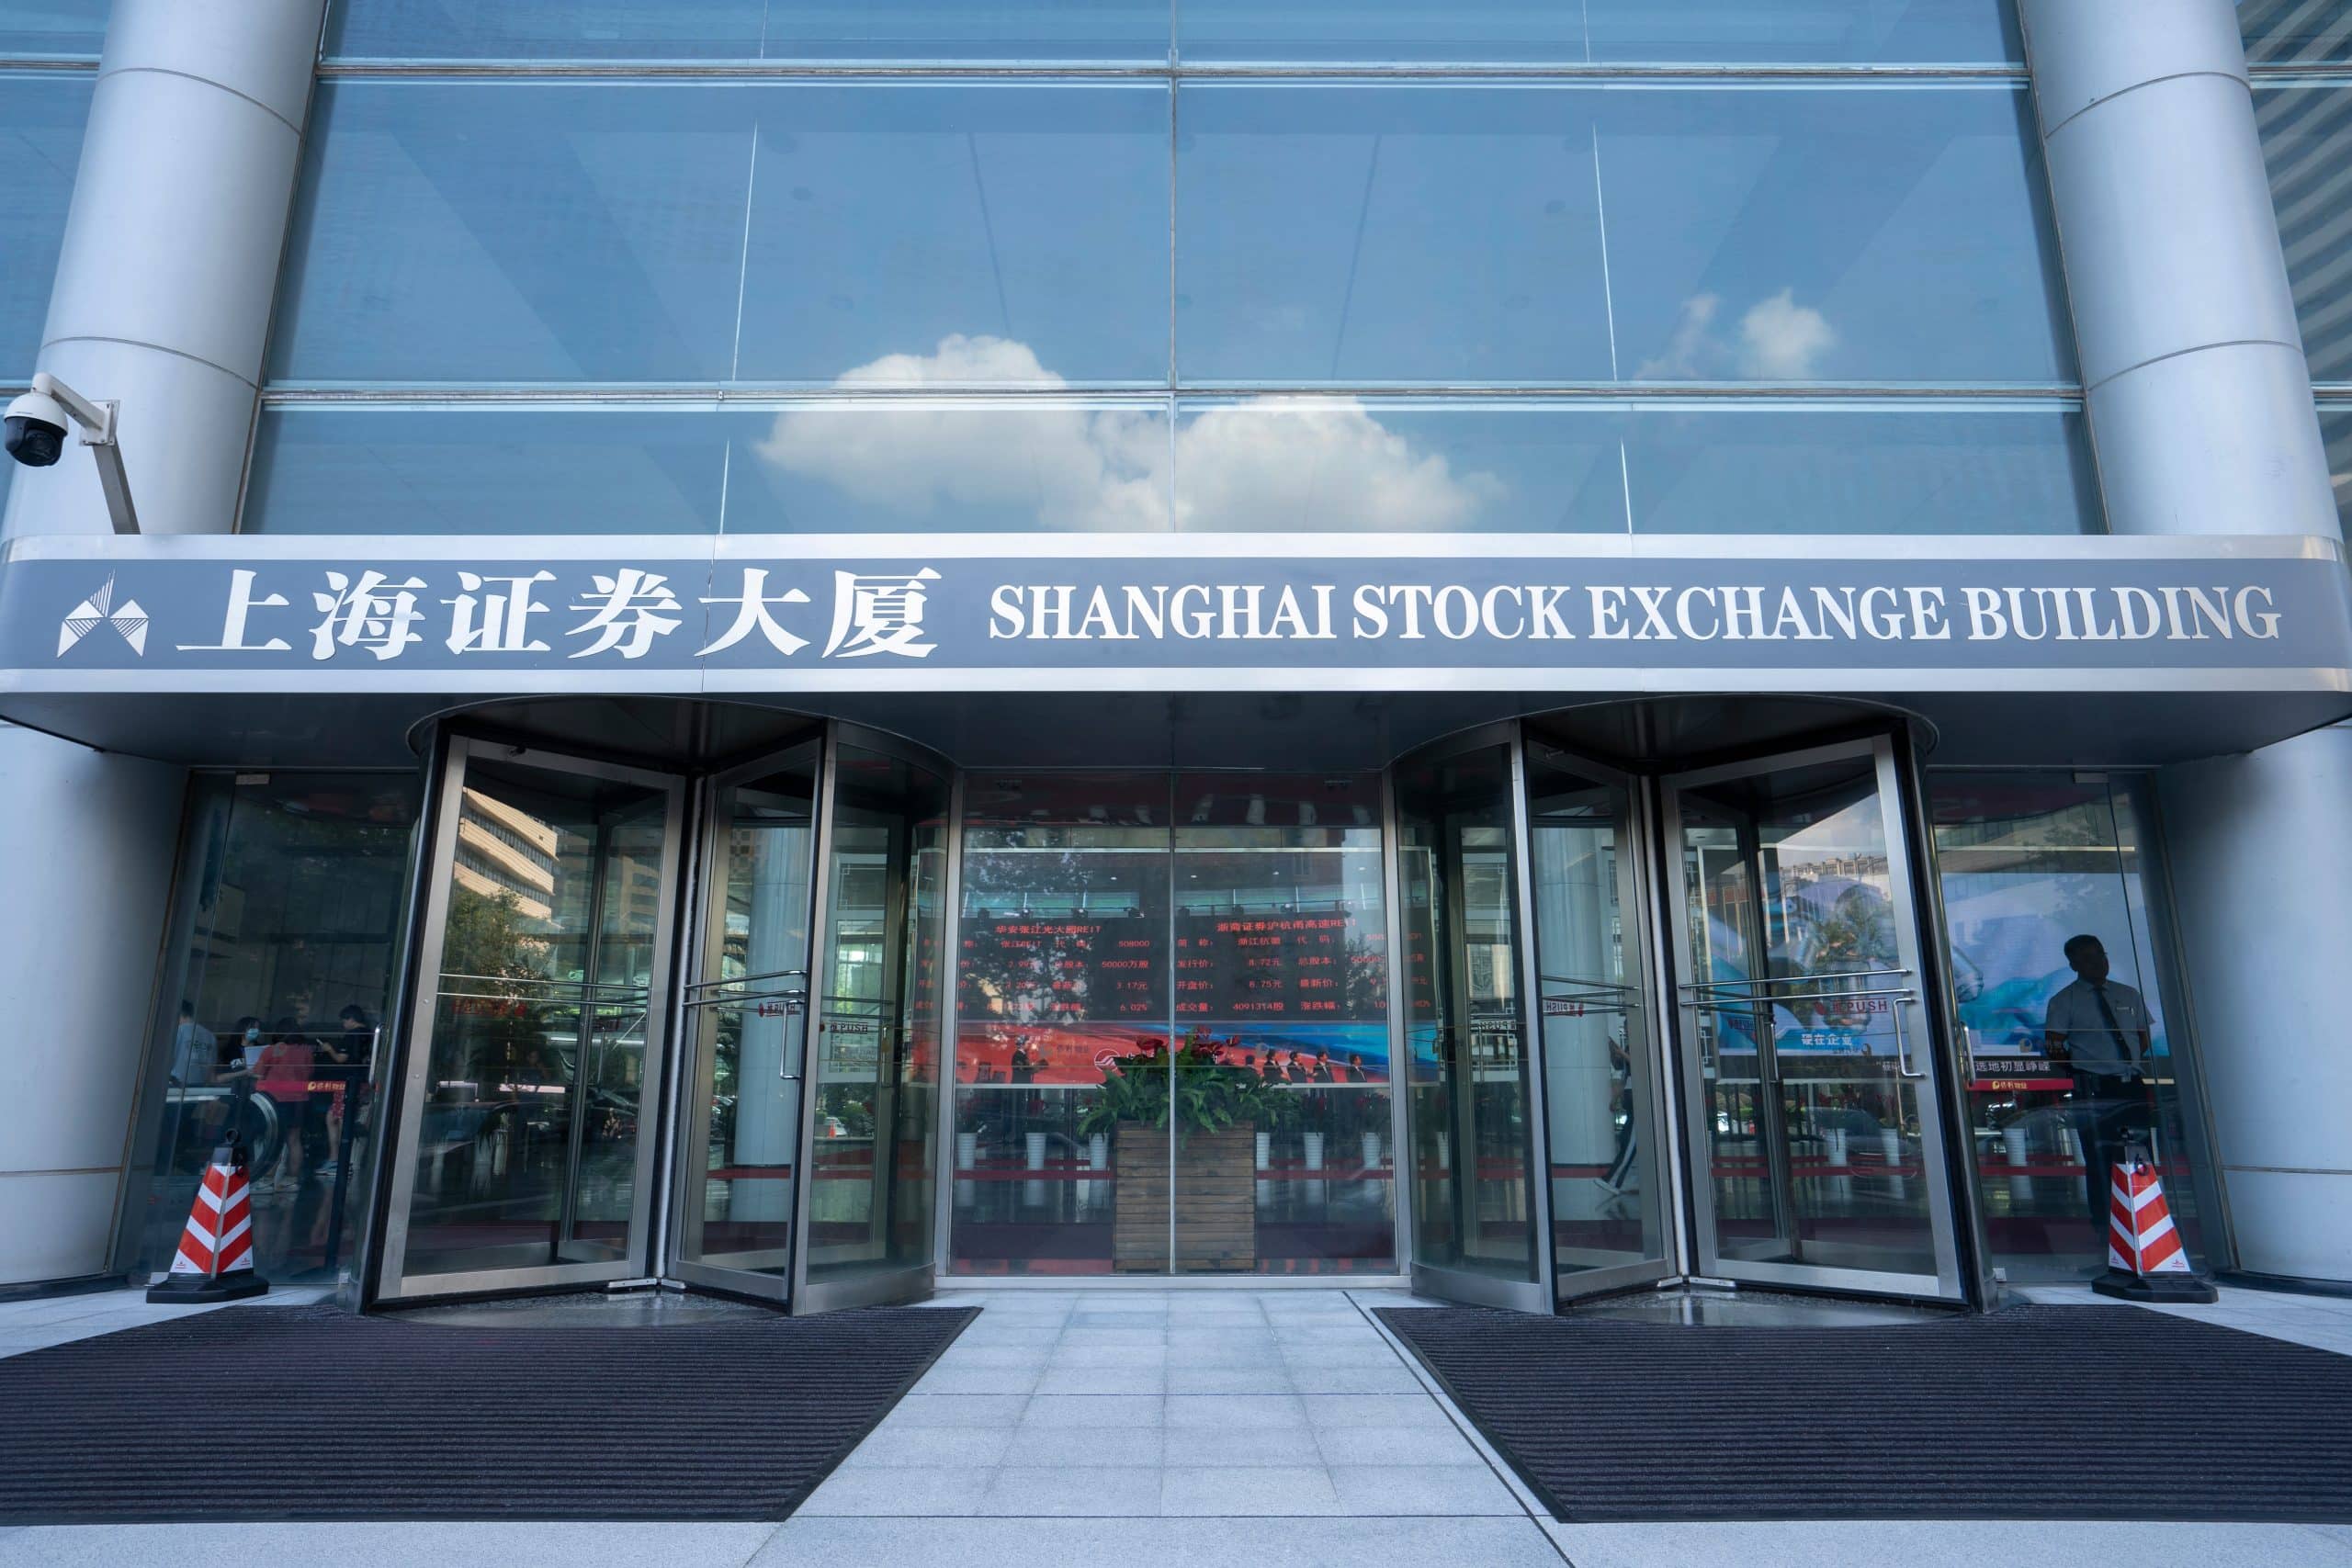
The SSE Composite Index (000001.SS) exhibited range-bound defensive price action across mainland bourses in Shanghai, ultimately settling at 3,930.12 to post a 5-day net contraction of 0.56%. This localized pause across China’s primary onshore capital market benchmark reflects institutional caution, as market participants actively weigh domestic industrial recovery data and targeted policy support against persistent property sector debt friction and expanding onshore-offshore equity yield spreads.
Deciphering Intraday Reversals and Technical Range Dynamics
Trading activity across the Shanghai Stock Exchange was marked by an early Friday rally that briefly propelled the benchmark to an intraday ceiling of 3,980.20, buoyed by positive international risk sentiment. However, profit-taking quickly set in during afternoon trading, dragging the index down to test a daily low of 3,915.22 before closing at 3,930.12 (0.30%, down 11.97 points from the previous close of 3,942.09). Operating in the upper quadrant of its 52-week trading bounds of 3,741.11 to 4,258.86, Friday’s trading volume reached 2.19 billion shares. This technical price behavior confirms that while buyers actively defended support near the 3,915 level, onshore investors remain cautious near overhead technical resistance tiers without sustained domestic policy catalysts.
Macroeconomic Drivers, Onshore-Offshore Divergence, and Policy Signals
As a broad benchmark heavily weighted toward state-owned enterprises, industrial conglomerates, financial institutions, and consumer staples, the operational trajectory of the SSE Composite is deeply tethered to mainland domestic consumption, credit expansion, and relative yield differentials. The 0.56% weekly decline highlighted a widening performance gap between mainland A-shares and offshore vehicles like Hong Kong’s Hang Seng Index, as international capital preferred Hong Kong-listed tech leaders over mainland domestic industrial shares. Furthermore, ongoing property market restructuring and expectations around People’s Bank of China (PBOC) liquidity operations present continuous structural factors shaping mainland asset valuations.
Strategic Portfolio Implications for the Israeli Ecosystem
For globally active portfolio managers and the interconnected Tel Aviv institutional community, tracking Shanghai Composite dynamics provides crucial guidance for managing East Asian equity exposure, emerging market risk budgets, and supply chain dependencies. Because China represents a core node in global industrial production and commercial trade, shifts in SSE Composite momentum directly inform multi-asset capital allocation models and commodity demand projections. Israeli institutional allocators must systematically cross-examine this mainland equity consolidation against persistent domestic shekel volatility, regional security risk premiums, and cross-border yield curves. Implementing disciplined currency hedging frameworks remains vital, as unexpected exchange rate swings between the CNY, USD, and ILS can mechanically introduce friction into localized portfolio returns.
Looking forward, the immediate structural trajectory centers on whether the SSE Composite Index can firmly establish a support baseline above the 3,915 technical floor or if overhead supply near 3,980 will trigger a mean-reversion toward lower quarterly support bands near 3,850. Market participants must remain highly attentive to upcoming Chinese industrial output figures, retail sales releases, and central bank monetary policy updates, which are poised to act as primary directional catalysts. The broader macroeconomic landscape presents a highly conditional outlook; while current price action reflects steady baseline support near multi-month lows, asset allocators must maintain a rigorous, probability-based framework, actively managing downside risks and monitoring sovereign policy shifts to safeguard long-term portfolio performance over the coming financial quarters.
Comparison, examination, and analysis between investment houses
Leave your details, and an expert from our team will get back to you as soon as possible
* This article, in whole or in part, does not contain any promise of investment returns, nor does it constitute professional advice to make investments in any particular field.
To read more about the full disclaimer, click here
- omer bar
- •
- 6 Min Read
- •
- ago 30 minutes
SKN | Japanese Yen Currency Index (^XDN) Advances 2.48% Weekly to 64.01: Is Yen Strength Coiling Ahead of Bank of Japan Rate Hike Signals?
The Japanese Yen Currency Index (^XDN) demonstrated strong upward momentum over the trading week, ultimately settling at 64.01 to
- ago 30 minutes
- •
- 6 Min Read

The Japanese Yen Currency Index (^XDN) demonstrated strong upward momentum over the trading week, ultimately settling at 64.01 to

- Lior mor
- •
- 7 Min Read
- •
- ago 1 hour
SKN | Australian Dollar Currency Index (^XDA) Advances 0.59% Weekly to 72.04: Is Commodity Currency Strength Anchored Near 52-Week Highs?
The Australian Dollar Currency Index (^XDA) demonstrated steady underlying strength over the trading week, ultimately settling at 72.04 to
- ago 1 hour
- •
- 7 Min Read

The Australian Dollar Currency Index (^XDA) demonstrated steady underlying strength over the trading week, ultimately settling at 72.04 to

- Arik Arkadi Sluzki
- •
- 6 Min Read
- •
- ago 2 hours
SKN | Nikkei 225 Rebounds 1.26% to 65,020.94: Are Japanese Equities Stabilizing Above Core Support Amid BOJ Rate Expectations?
The Nikkei 225 Index staged a strong late-week recovery on the Osaka Exchange, rising 1.26% on Friday to settle
- ago 2 hours
- •
- 6 Min Read

The Nikkei 225 Index staged a strong late-week recovery on the Osaka Exchange, rising 1.26% on Friday to settle

- Ronny Mor
- •
- 8 Min Read
- •
- ago 8 hours
SKN | Nike’s S&P 100 Exit Signals a Deeper Crisis: Can the Sportswear Giant Rebuild Its Market Position?
The deterioration in Nike’s equity value has reached an important symbolic milestone. S&P Dow Jones Indices announced that NIKE
- ago 8 hours
- •
- 8 Min Read

The deterioration in Nike’s equity value has reached an important symbolic milestone. S&P Dow Jones Indices announced that NIKE
