




- Ronny Mor
- •
- 10 Min Read
- •
- 1 month ago


Key Points
- The Bearish Signal Weakens: The percentage of indicators warning of a bear market has dropped from 70% to 60%, driven by improving credit conditions and a cooling in the momentum of mega-cap technology stocks.
- A Look at the Next Decade: Despite the contraction of the forward P/E ratio to 20x, the bank's historical models still point to the potential for negative long-term average returns.
- Investment Strategy: Analysts favor large-cap value stocks as a stable anchor, explicitly warning against "value traps" in the media and IT services sectors.

The volatility that characterized the markets in recent months is giving way to a reassessment among major institutional players on Wall Street. Bank of America, a prominent voice in macroeconomic analysis, recently updated its clients that its market alert model has shifted from a red danger zone to a more moderate yellow environment. This retreat from the maximum bear market alert comes after a tense period where most economic indicators signaled a significant slowdown. However, lowering the threat level does not constitute an all-clear siren or a call for euphoria. The bank’s economists frame this current improvement within a broader context of pricing and credit cycle risks, signaling to investors that the current environment demands selective asset allocation and extreme caution in light of historical data.
Market Signals: From Red to Yellow in a Changing Environment
Until the end of May, investors tracking Bank of America’s models faced a challenging reality, as 70% of the bank’s bear market warning signs were triggered simultaneously. Historically, this figure pushed the market into a bright red flag zone, indicating a high probability of sell-offs. That picture has since changed. The bank’s head quantitative strategist, Savita Subramanian, noted that the proportion of triggered indicators recently dropped to 60%. This decline is attributed to a marked improvement in market credit conditions, alongside a welcome cooling of the frothy price action that characterized mega-cap technology stocks, which have returned to more balanced trading rhythms. Despite this improving trend, historical analysis of a 60% activation rate reveals a rather tepid business reality: the median return of the S&P 500 over the subsequent 12 months has historically stood at just 3%, a figure that may disappoint investors seeking excess returns in a dynamic interest rate environment.
The Pricing Question and the Statistical Multiple Trap
The valuation of the American equity market remains a point of contention among investment managers and hedge funds. Bank of America positively notes that the S&P 500’s forward price-to-earnings (P/E) multiple has contracted from a high of 22 at the start of the year to 20 today. This contraction occurred for healthy fundamental reasons, as the pace of corporate earnings growth managed to outstrip the rate of share price appreciation. Nevertheless, through a long-term institutional lens, the current valuation still does not provide fertile ground for a multi-year bullish rally. The bank’s historical models, which examine relative pricing over decades, continue to suggest the potential for average annual losses of 3% over the next decade. This data highlights the conceptual gap between short-term traders riding a localized positive momentum and value investors who must price in future growth risks.
Credit Cycles and the Psychology of Stress
Alongside valuation analysis, the bank provides a strategic perspective on the dynamics of credit cycles and their impact on market stability. The firm’s economists warn that credit cycles are characterized by deceptively behavioral patterns: they tend to start slowly and under the radar, but end rapidly and often with sharp pain for leveraged investors. An analysis of major financial stress periods since the 1990s shows that the first half of a credit spread widening typically took, on average, six times longer than the second half. This pattern illustrates how behavioral biases, such as the illusion of control and overcomplacency, cause investors to ignore early market warning signs until repricing occurs violently.
Investment Strategy: Where the Institutional Safe Haven Lies
Given this complex picture, Bank of America draws a clear roadmap for defensive investors. The primary recommendation is to seek an anchor of stability by focusing on large-cap value stocks. Analysts emphasize traditional sectors expected to demonstrate cash flow resilience, including oil and gas, distributors, metals and mining, as well as the banking and insurance sectors. These industries generally benefit from more realistic valuations that are less sensitive to extreme macroeconomic shocks. Conversely, the bank places a clear warning sign against so-called “value traps”—stocks that appear cheap on trading screens but conceal ongoing fundamental deterioration. This cautious focus is directed primarily at the media and IT services sectors, where the rapid decline in share prices is still failing to keep pace with analysts’ downward revisions to earnings forecasts.
The transition in Bank of America’s signals from red to yellow perfectly reflects the structural complexity of Wall Street today, where good news on the credit front meets deep valuation challenges. For portfolio managers and sophisticated investors, the easing of the alert model is not an invitation to breach risk limits, but rather a window of opportunity for portfolio recalibration. In the coming months, the true test for the markets will lie in the ability of traditional corporate giants to justify their cash-flow standing against a much more selective economic environment. The market has taken a step back from the edge of the bearish cliff, but the path to a clear, long-term growth trajectory still requires strategic navigation, patience, and a deep understanding of new pricing dynamics.
Comparison, examination, and analysis between investment houses
Leave your details, and an expert from our team will get back to you as soon as possible
* This article, in whole or in part, does not contain any promise of investment returns, nor does it constitute professional advice to make investments in any particular field.
To read more about the full disclaimer, click here
- Lior mor
- •
- 6 Min Read
- •
- ago 6 hours
SKN | Wall Street Ends Week Higher as Earnings and Inflation Data Take Center Stage
Wall Street closed higher on Friday as investors shifted their attention toward the next stage of the market calendar,
- ago 6 hours
- •
- 6 Min Read

Wall Street closed higher on Friday as investors shifted their attention toward the next stage of the market calendar,
- Lior mor
- •
- 7 Min Read
- •
- ago 7 hours
SKN | Can Bank Earnings and September CPI Determine the S&P 500’s Next Move Near Record Highs?
Wall Street Faces a Critical Test of Its Rally U.S. equity markets are entering a consequential week as major bank
- ago 7 hours
- •
- 7 Min Read

Wall Street Faces a Critical Test of Its Rally U.S. equity markets are entering a consequential week as major bank

- sagi habasov
- •
- 7 Min Read
- •
- ago 7 hours
SKN | AI-Fueled U.S. Stock Bull Market Approaches Four-Year Milestone
The U.S. stock market is approaching a significant milestone, with the current bull market nearing its four-year anniversary as
- ago 7 hours
- •
- 7 Min Read

The U.S. stock market is approaching a significant milestone, with the current bull market nearing its four-year anniversary as

- orshu
- •
- 7 Min Read
- •
- ago 7 hours
SKN | Wall Street Faces Busy Week as Bank Earnings and Inflation Data Test Market Rally
U.S. equity markets enter a particularly important week as investors prepare to assess the strength of corporate earnings alongside
- ago 7 hours
- •
- 7 Min Read
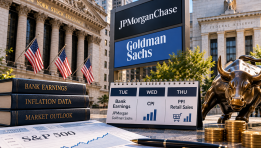
U.S. equity markets enter a particularly important week as investors prepare to assess the strength of corporate earnings alongside