


SKN | The Bond Vigilantes: How Investors Are Doing the Federal Reserve’s Dirty Work
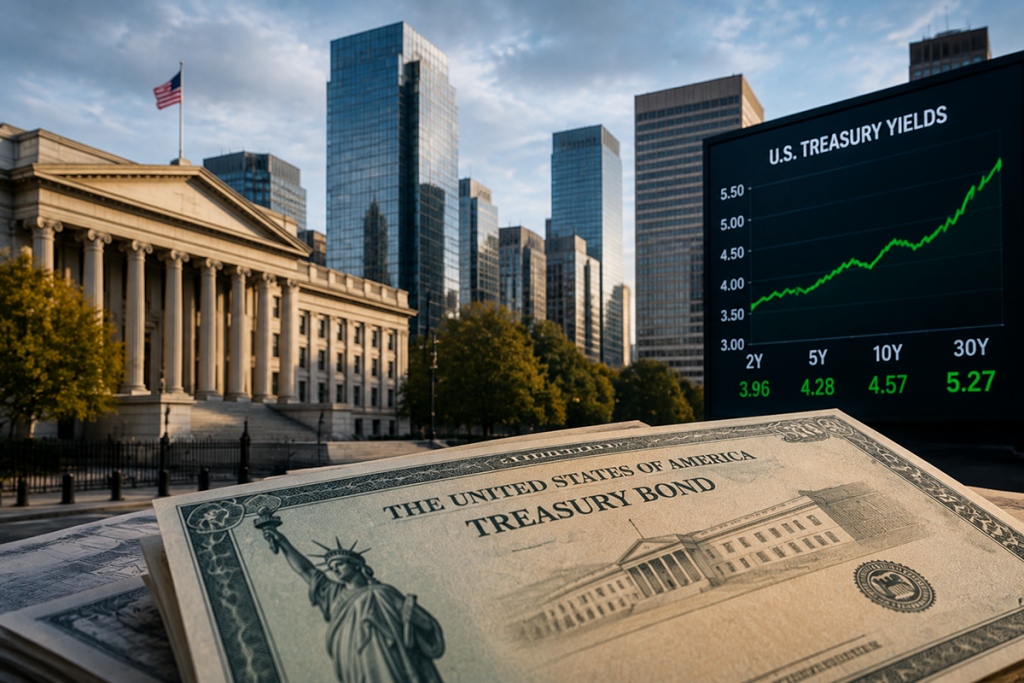
Bonds & Foreign Exchange Capital markets in the United States are currently facing a fascinating dynamic where market forces are seizing the reins from the central bank. While the Federal Reserve maintains stability in its short-term interest rates, bond market investors are actively repricing risk and pushing long-term borrowing costs to highs not seen in nearly two decades. […]