


- orshu
- •
- 6 Min Read
- •
- 2 hours ago
Key Points
- The Hang Seng Index (^HSI) concluded the trading week on March 13 at 25,465.60, registering a moderate 5-day decline of 1.13%.
- After testing the 26,000 psychological threshold mid-week, the index encountered technical resistance leading to a late-week retracement.
- Despite the daily pullback of 0.98%, strong liquidity and comfortable positioning above the 52-week lows suggest underlying market stability.
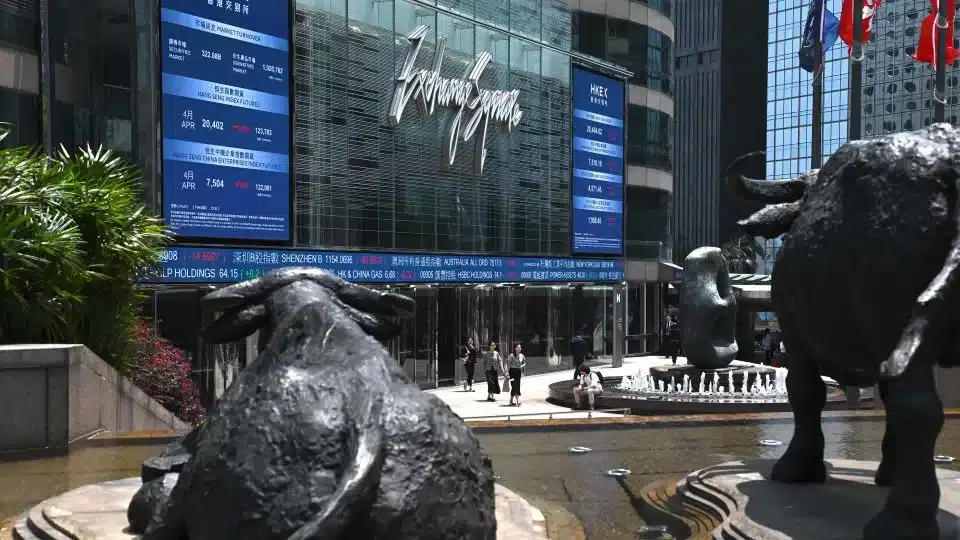
The Hang Seng Index (^HSI) concluded the trading week ending March 13 at 25,465.60, reflecting a contained contraction amid broader global market shifts. For sophisticated investors in Israel and abroad monitoring Asian equities, the index’s relatively measured 5-day decline of 1.13% highlights a complex interplay between regional economic vitality and international market sentiment.
Weekly Performance and Technical Price Action
Trading activity throughout the week demonstrated noticeable volatility within a defined channel. The index opened the Friday session at 25,583.55, ultimately closing down 0.98% for the day, which equates to a 251.16-point drop from the previous close of 25,716.76. Examining the five-day trajectory, the HSI experienced an early-week rally, successfully peaking above the 26,000 resistance level on March 11. However, this bullish momentum proved unsustainable in the short term, giving way to persistent selling pressure that pushed the index toward its weekly lows. The Friday session’s intraday trading range between 25,419.87 and 25,697.17 indicates a clear testing of near-term support levels, though the index ultimately managed to avoid breaking below the crucial 25,400 mark.
Broader Market Context and Liquidity
When contextualized against its robust 52-week range of 19,260.21 to 28,056.10, the Hang Seng’s current valuation remains structurally sound. This positioning suggests underlying Asian market resilience despite the localized late-week sell-off. Furthermore, the robust average trading volume of over 3.14 billion shares underscores sustained institutional participation and deep liquidity within the Hong Kong exchange. For global allocators and Israeli investors looking to maintain globally diversified portfolios, this week’s price action represents a technical recalibration rather than a fundamental breakdown. The sharp pullback from the mid-week highs aligns with standard technical resistance and subsequent profit-taking behaviors, highlighting the ongoing search for pricing equilibrium in Asian equities.
Macro Implications for Global Portfolios
The relatively contained 1.13% weekly drawdown highlights the unique dynamics of the Hong Kong market compared to broader Western indices. For investors building cross-border strategies, the Hang Seng serves as a vital barometer for both regional economic health and mainland Chinese corporate performance. Monitoring these localized pullbacks offers valuable data points for assessing regional risk appetite. The ability of the HSI to absorb immediate selling pressure without capitulating signals a mature market environment that can offer valuable portfolio diversification and uncorrelated return potential for well-structured international portfolios.
Looking ahead, market participants will be closely evaluating the Hang Seng Index’s ability to firmly defend the 25,400 support zone in upcoming sessions. Should this critical level hold, it may provide a strong technical foundation for a near-term recovery and another test of the 26,000 resistance ceiling. Conversely, a confirmed break below could expose the index to further downside exploration. Investors should maintain a vigilant watch on incoming macroeconomic data from mainland China and global central bank policy shifts, as these fundamental catalysts will dictate the next directional phase. Actively managing risk while identifying strategic Asian market opportunities remains paramount for navigating the evolving global financial landscape.
Comparison, examination, and analysis between investment houses
Leave your details, and an expert from our team will get back to you as soon as possible
* This article, in whole or in part, does not contain any promise of investment returns, nor does it constitute professional advice to make investments in any particular field.
To read more about the full disclaimer, click here
- sagi habasov
- •
- 6 Min Read
- •
- ago 22 minutes
SKN | Navigating Volatility: What Drove the Nikkei 225’s Mid-Week Consolidation?
The Nikkei 225 concluded the trading week with a notable pullback, closing down 633.35 points at 53,819.61 on Friday,
- ago 22 minutes
- •
- 6 Min Read
The Nikkei 225 concluded the trading week with a notable pullback, closing down 633.35 points at 53,819.61 on Friday,

- Lior mor
- •
- 6 Min Read
- •
- ago 13 hours
SKN | Shanghai Composite Retreats from Mid-Week Highs: A Healthy Correction or Approaching Headwinds?
The Shanghai Composite Index experienced a volatile trading week, ultimately paring mid-week gains to close lower amidst shifting macroeconomic
- ago 13 hours
- •
- 6 Min Read
The Shanghai Composite Index experienced a volatile trading week, ultimately paring mid-week gains to close lower amidst shifting macroeconomic

- Arik Arkadi Sluzki
- •
- 6 Min Read
- •
- ago 14 hours
SKN | Is the Japanese Yen Searching for a Floor Amid Shifting Global Yields?
The Japanese Yen Currency Index (^XDN) navigated a challenging week of trading, recording a cumulative 1.24% decline to close
- ago 14 hours
- •
- 6 Min Read

The Japanese Yen Currency Index (^XDN) navigated a challenging week of trading, recording a cumulative 1.24% decline to close
- sagi habasov
- •
- 6 Min Read
- •
- ago 15 hours
SKN | Navigating European Equities: What Drove the MSCI Europe Index’s 1.14% Weekly Contraction?
European equities encountered renewed headwinds this week, with the MSCI Europe Index experiencing a measured contraction of 1.14% to
- ago 15 hours
- •
- 6 Min Read

European equities encountered renewed headwinds this week, with the MSCI Europe Index experiencing a measured contraction of 1.14% to

